
Using a combination of Bases, Dataview and custom CSS I’ve built a new and improved reading dashboard that I’m very excited about!
I absolutely love Obsidian’s bases update! I’ve been able to use it to create a new and improved reading dashboard in my vault.
Now, this ‘dashboard’ is just a note like any other, but I’ve embedded various Dataview and Bases queries to display information about what I’ve been reading, and then used custom CSS snippets to make it look more compact and dashboard-like.
I actually spent a ridiculous amount of time playing around with the CSS. I hadn’t really done that before (amazing since I’ve had Obsidian for over 2 years), but once I looked up how to figure out the CSS tags (you can just use the ctrl + i inspect tool!) I could not stop myself.
Dynamically querying books read in the current year
The first thing to figure out was how I could build this so that it would update itself for a new year, so that I’d not have to manually change every code block come January.
This is the filter query I ended up with, after hours of trying to make sense of the documentation! I have this problem at work too; developers are more often than not terrible at documentation and real-world working examples to explain things!
now().date().format("YYYY") == date(note["date-read"]).format("YYYY")There might be a better/more concise way to do it than this! But the approach I ended up with is basically formatting the current date down to its YYYY value and comparing that against my date-read property date also formatted down to its YYYY value. It seems to work!
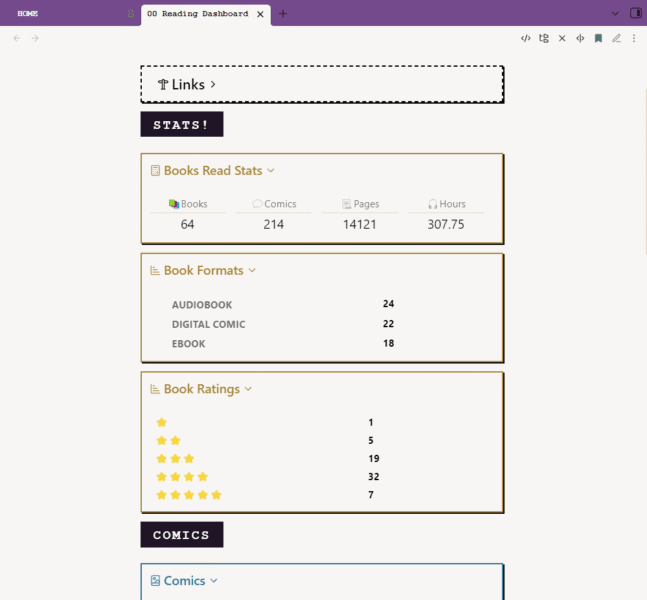
Books Read Counts
At the moment, Bases can’t handle grouping, and it’s not possible to do things like get a neat total of books read by type. I’m still using Dataview for this.
The numbers I’m displaying are for the number of books and comics read, and the total pages or hours. Pages and hours are numeric property values in each note. Each one of those is its own dataview code block, but I’ve used CSS to get them all in a row together.
Working out how to apply the CSS was a pain in the arse, but I found a useful forum post that almost explained it, and trial and error then got me there.
The #_/page-stats sitting within the callouts are how the dataviews are being targeted.
> [!stats-calc]+ Books Read Stats
> #_/page-stats
> ```dataview
> TABLE WITHOUT ID
> length(rows) as 📚Books
> FROM "04 Books/Books Read"
> WHERE date-read > date(soy) and type = "Book Review"
> GROUP by type
> ```
> ```dataview
> TABLE without id
> length(rows) as 💬Comics
> FROM "04 Books/Comics"
> WHERE date-read > date(soy)
> GROUP by type
> ```
> ```dataview
>TABLE WITHOUT ID
>sum(rows.pages-count) as 📃Pages
>FROM "04 Books/Books Read"
>WHERE (date-read > date(soy) and pages-count > 0) and type = "Book Review"
>GROUP by type
>```
> ```dataview
> TABLE WITHOUT ID
> sum(rows.duration) as 🎧Hours
> FROM "04 Books/Books Read"
> WHERE (date-read > date(soy) and duration > 0) and type = "Book Review"
> GROUP by type
> ```
Note that date-read > date(soy) is the dynamic date query for Dataview, this is very different to Bases!
In my CSS snippet, I have this.
/* DATA VIEW STYLING */

/* hide the targing tag */
[href^="#_"] {
    display: none!important;
	font-size: 300%;
}

/* STATS Callout with #_/page-stats for dataview single number calculations */
.dashboard div.callout:has([href="#_/page-stats"]) {
	padding:12px!important;
   & div.callout-title {
     font-size: 1.4rem!important;
   }
   & .dataview.small-text {
     display: none;
   }
    & .table-view-th {
     font-size: 1.1rem!important;
	 text-align: center;
   }
    & .table-view-table > tbody > tr > td {
     font-size: 1.4rem!important;
	 text-align: center;
   }
    & .block-language-dataview {
     float: left;
	 width: 25%;
   }
}
I then have some other callouts that contain dataview code blocks to group counts by different pieces of data within my note properties, for example, the number of books read by format. These are slightly different to the above and have different styling.
> [!stats-chart]+ Book Formats
> #_/format-stats
> ```dataview
> TABLE length(rows) as Number
> FROM "04 Books/Books Read"
> WHERE date-read > date(soy)
> GROUP by format
> ```

>[!stats-chart]+  Book Ratings
> #_/format-stats
> ```dataview
> TABLE length(rows) as Number
> FROM "04 Books/Books Read"
> WHERE date-read > date(soy)
> GROUP by reduce(["⭐", rating], "*")
> SORT rating asc
> ```
Note that reduce(["⭐", rating], "*") allows my numeric rating values to be displayed as star emojis.
Bases
Further down, I start to use base code blocks to break up my data into lists, such as audiobooks and print books.
Note, there are two ways to embed bases into a note. You can use the markdown ![[nameOfyourBase.base]] transclusion to display an existing .bases notes file, or you can embed a code block that will exist only within that note.
For my dashboard, I used all code blocks so I could customise them more easily without it affecting anything else in the value.
In my example below, I’ve built a base code block with a built-in filter to show only audiobooks, and within that, made some views which each of which has its own filter to display books by the audiobook source.
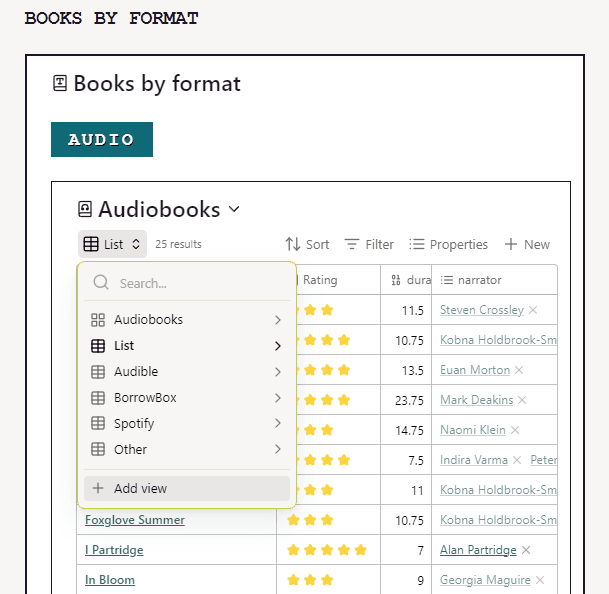
Note, to display numeric ratings as star emojis in a base, you need to add a Properties formula like this: "⭐".repeat(rating) (I did not figure this out myself, I saw it on Reddit, I think, and didn’t save the thread!)
Adding a base code block is actually super easy! You don’t even need to add any coding; you can just add an empty base, and that’ll insert a blank one that you can further configure with the UI, and it’ll fill out the code for you!
Each of my sections is in a callout I’ve set to collapsible, also under a collapsible heading, to make it easy to navigate.
You can also put callouts inside callouts, which is nice!
One note on bases inside callouts, though, it seems to be a bit buggy. I found that if the base code was inside the callout, then if I messed around with the settings for filters or properties, it would not get saved into the code, meaning it would be reset when I load the page. So if you put bases inside callouts, I’d recommend getting all your settings nailed down first!
I have customised all the callouts on this dashboard – because it’s fun to! – If you want to know how there is information in the Obsidian Help here.
Links
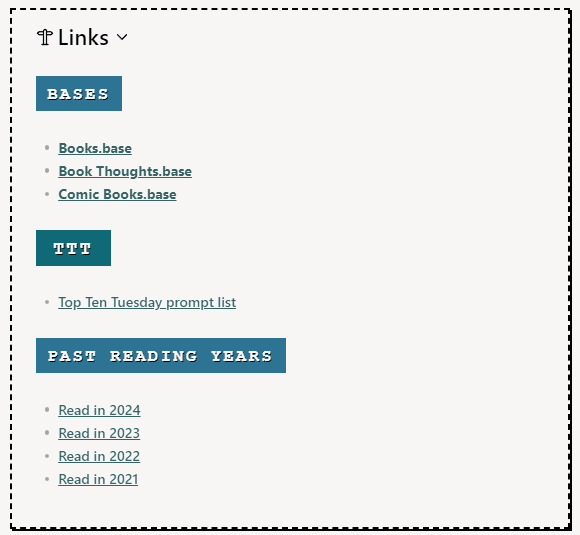
At the top of my Dashboard, I also have a neat little collapsible callout where I put useful links to other notes or bases in my vault to make things easy to find for reference.
My Reading dashboard is also linked to in a similar callout from my Homepage note. I have also been working on setting up a few similar ‘dashboard’ type notes for other areas of my vault, such as my embroidery projects. I’m hoping the ease of using bases and the visual appeal of the card views will encourage me to be better at saving inspiring images, ideas and creators I find interesting for later reference!
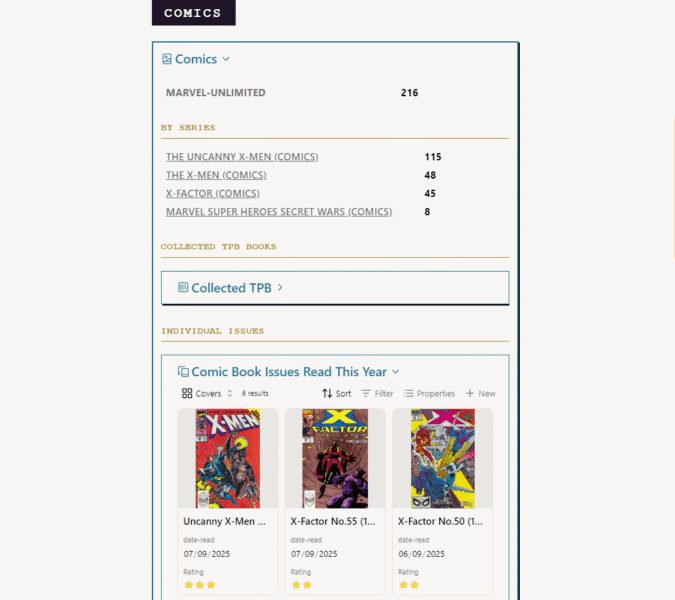
Next, I’ll share how I’ve set up comic book issues in the vault!

Well done for wrangling the CSS. I always used to struggle with it- it felt too much like a dark art for me to be able to master. And thanks for leaving code snippets and explainers up
CSS is a bit of a rabbit hole, there is a loads of help online with it though I’d not necessarily advise starting with Obsidian. It’s fiddly to fight through the browser inspect tool to find the bit you want!